
Climate Pathways: How we calculate temperature scores
Our Climate Pathway API provides the ultimate climate calculator for anyone optimizing the climate impact of their investments and activities. By scaling the practices of each corporation we provide the bottom line environmental impact of corporations under any number of assumptions and scenarios such as their current emissions, their stated targets, or how you think they are going to evolve in the future.
But how does it work?
We take a simple approach: The goal is to scale the emissions of each corporation to see what global emissions would be if everyone behaved similarly to the given company. The best way to do this is to scale the emissions of each corporation according to its size.
Let’s assume the company has a total of 1 million metric tonnes of CO2eq across scopes 1, 2 and 3 emissions. While operating and emitting (including up and down the supply chain), the company made $1 billion in revenue. Now, with the global GDP being ~91 trillion as of 2021, this company represents 0.001% of the global economy. That means, if everyone had the impact of this company, the annual global emissions would be 91 billion metric tonnes of CO2eq. That’s not great, given the current actual annual emissions are about 35 billion metric tonnes! So this company certainly belongs to a climate scenario that has higher temperatures by the end of the century.
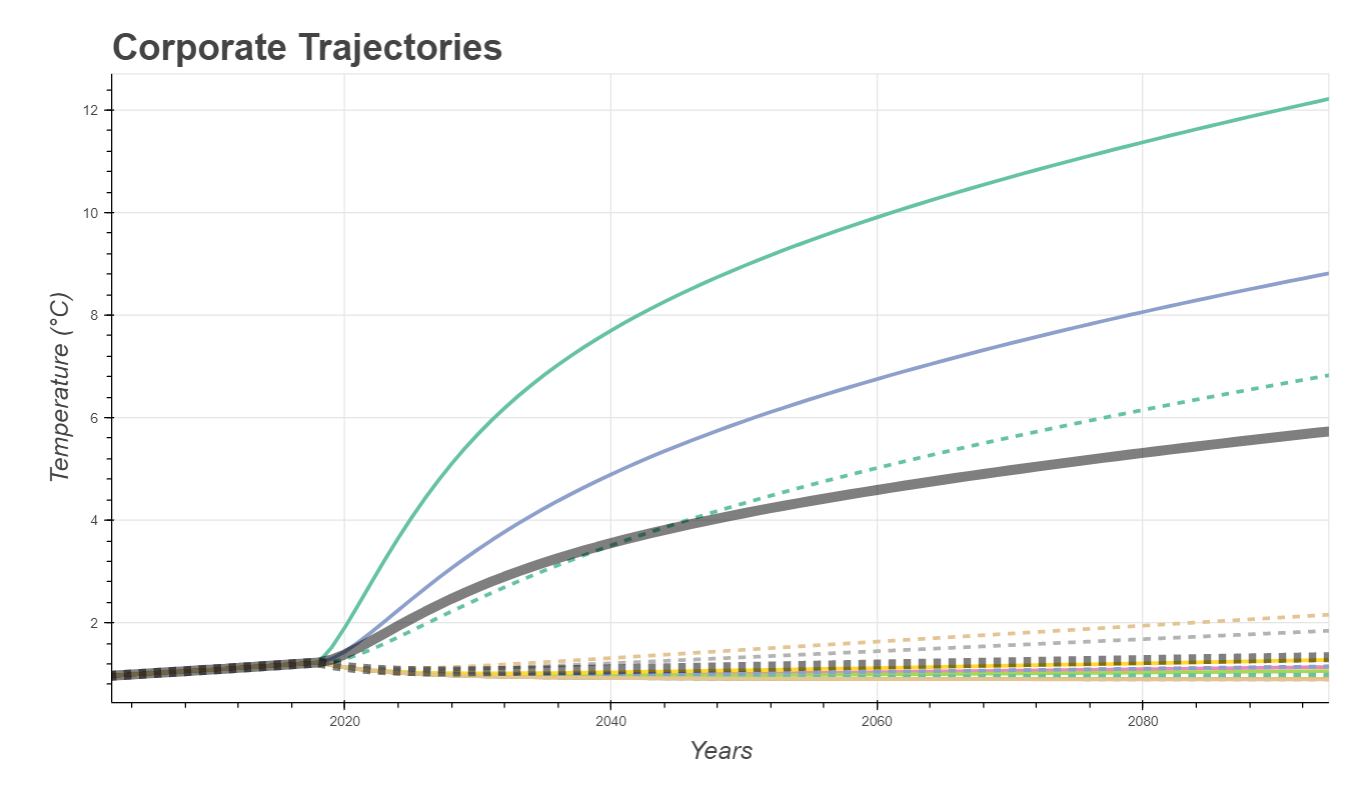
To find out exactly how much, we use our climate models. Given the total amount of greenhouse gas forcing in this scenario we run our climate model forward to the end of the century to get the trajectory of temperature rise, sea level rise, and even biodiversity loss.
But what if Scope 3 data is not available?
Many corporations still do not report their scope 3 emissions — emissions from up and down the supply chain, as well as those of investments, franchises, travel and commute, and other categories. Let’s say our company above has a total scope 1 and 2 emission of 10,000 metric tonnes CO2eq. These correspond to the direct emissions of the company, as well as indirect emissions from the energy usage of the company, such as the electricity it draws from the grid, but not those of the supply chain. As such, the corresponding measure of the size of the company should be a measure of the value the company generates, without including the cost of everything up the supply chain. A good proxy for this is the gross profits of the company. If you are buying a phone, you are indirectly paying for all the raw materials that went into it, the mining and processing of precious metals, and everything else. A product that is way down the supply chain has to include all the upstream costs into the selling price. Thus, revenue implicitly takes the supply chain into account. But gross profit represents how much the company earns after all the costs have been removed. So if the emissions from scopes 1 and 2 led to $100 million gross profit, the company represents 0.0001% of the global economy. The equivalent global forcing in this case would be 9.1 billion metric tonnes of CO2eq - an order of magnitude lower than the forcing when taking the whole supply chain into account.
We provide the pathways for both scope 1+2 and scope 1+2+3. It’s noteworthy to point out that using revenue to represent the value of the whole supply chain can be a good proxy when dealing with companies that have most of their scope 3 emissions before them up the supply chain. However, when dealing with companies that operate near the top of the chain (such as mining or oil and gas companies), this proxy does not take into account the value that is added below them.
While this approach provides a baseline for evaluating corporations across all industries, we are working on industry-specific metrics to take more nuanced details into account within the supply chain in each vertical. So make sure to stay tuned!
One last thing… I understand the scaling of emissions — but why should I trust your climate models?
The good news is that it is a lot more straightforward to benchmark our physical climate models. We can simply run the climate model forward in time under various forcing scenarios, and compare the results with those of established models. We have previously shown that our climate model is able to closely replicate the results of the 30 CMIP5 (Coupled Model Intercomparison Project Phase 5) models that are used in the IPCC report. A quick look at the results under various RCP (Representative Concentration Pathways) forcing scenarios shows this agreement, which is not just in the range of all models, but is in fact in close agreement with the mean:
| RCP Scenario | IPCC 2081-2100 Mean Temperature (oC) | IPCC 2081-2100 Temperature Range (oC) | EnvAI's 2081-2100 Mean Temperature (oC) |
|---|---|---|---|
| RCP 2.6 | 1.0 | 0.3 - 1.7 | 0.8 |
| RCP 4.5 | 1.8 | 1.1 - 2.6 | 1.5 |
| RCP 6.0 | 2.2 | 1.4 - 3.1 | 2.0 |
| RCP 8.5 | 3.7 | 2.6 - 4.8 | 3.2 |
If you have questions regarding our methodology, or want to have a chat, do not hesitate to reach out!

Contact us to learn more about the Climate Pathways and get access to the API!